Banking on Disaster: Fed Continues to TightenThe Federal Reserve's extreme tightening just caused the second-largest bank collapse in U.S. history (in nominal dollars).
In this post, I will explain just how far the contagion is likely to spread, and why this is likely just the start of what may be widespread liquidity crises.
In early 2022, in order to mitigate the record inflation it caused, the Fed began hiking interest rates. By mid-2022, the Fed was raising interest rates at the fastest pace on record. The rate of change (or ROC) in Treasury yields began to rise parabolically. Below is a chart that I posted back in August 2022 to show how extreme the rate of change was for the 2-year U.S. Treasury bond yield.
Since bond prices move inversely to yields, bond prices began to fall sharply in 2022 as yields were rising. In October 2022, I posted the below ratio chart of TLT and M2SL to illustrate the immense wealth destruction that holding Treasury bonds was having for investors and institutions. I warned that what was occurring is destabilizing.
To understand how I used the ratio chart of TLT and M2SL to conclude that, due to the Fed's extreme tightening, destabilizing wealth destruction was occurring for bondholders, you can see my post below.
By late 2022, it became a mathematical certainty that liquidity crises would occur. Many market participants who were holding extremely low-yielding bonds were experiencing extreme losses because of the Fed's extreme rate hikes. Such losses are unrealized unless the bondholders are forced to liquidate while yields are much higher than when the bonds were purchased. For those who recall what happened in October 2022, pension funds in the UK were forced to liquidate their highly leveraged bond positions at a loss due to margin calls. This caused the Bank of England to quickly pivot in order to avert a major liquidity crisis for pension funds.
Silicon Valley Bank ( SIVB ) however was not as lucky as UK pension funds. SIVB was at the forefront of the central bank-engineered liquidity crisis because of its unique clientele: debt-dependent start-ups. As liquidity was being destroyed by the Fed at a record pace in 2022, start-ups, which are heavily reliant on debt and cheap money to continue operations and generate growth, began to draw down their deposits as cash evaporated and borrowing became more expensive. This in turn forced SIVB to liquidate its bond holdings at a major loss, similar to the UK pension funds in October 2022. Once Silicon Valley Bank reported this major loss to the public, the market suddenly began to fear its viability. Within days, the bank collapsed.
The collapse of SIVB occurred with an estimated 85% to 96% of all deposit amounts not being FDIC-insured. This means that most of the $175 billion in deposits at the time of the collapse may be partially or totally unrecoverable. Two things about the bank's collapse are remarkable: First, the unprecedented speed by which the bank collapsed and was seized by the FDIC, and, second, the overwhelming majority of the money deposited in the bank was not FDIC-insured. This is quite concerning because such a lack of FDIC insurance on deposits undermines the public's faith in the FDIC to maintain banking stability. Such a lack of insurance also causes actual liquidity contagion.
Circle, the company that manages the USDC stablecoin, has confirmed that $3.3 billion of its U.S. dollar reserves were in the now-collapsed bank. At the time of writing, Circle does not know if or when the FDIC will come to the rescue.
It's possible that neither the FDIC nor the U.S. Treasury comes to Circle's rescue, as neither entities are eager to support the cryptocurrency industry, which undermines U.S. dollar hegemony. The FDIC, therefore, faces a major conundrum: Maintain the public's faith in FDIC-guaranteed banking and ensure there is no liquidity contagion, at the expense of acting as a protector of stablecoins and cryptocurrency, and more generally, increasing moral hazard.
Nonetheless, this fear that the FDIC may not come to the rescue has caused USDC to de-peg from the US dollar. Each USDC is now worth less than one US dollar, as shown in the chart below.
Upon seeing USDC rapidly de-pegging, the cryptocurrency exchange platform, Coinbase, decided to temporarily freeze USDC conversion into U.S. dollars, forcing a reprieve in USDC's de-pegging.
Nonetheless, at the time of writing, USDC is still teetering on the brink of collapse, having lost nearly 90% of the Tether ( USDT ) in its 3pool currency reserves.
USDC instability is now spilling over into other cryptocurrency spaces that rely on USDC maintaining a stable value. One such space is the AAVE protocol. AAVE is an Open Source Liquidity Protocol that operates on the premise that only "low-risk tokens" such as USDC be used as collateral and as a lending pool reserve.
Now that USDC has de-pegged from the U.S. dollar, any collateral that was pledged in USDC is now suddenly worth less. This is destabilizing the liquidity and reserve structure of the AAVE protocol. AAVE currently has $6 billion of locked liquidity across its networks.
Although it is possible that the FDIC can fully resolve the crisis caused by the Silicon Valley Bank collapse, it is likely that volatility may persist, especially when Coinbase resumes USDC swaps. In a worst-case scenario, USDC may follow the same trajectory as TerraUSD (UST) in May 2022. In this scenario, the shockwaves will be felt not only across the cryptocurrency space but also in the Treasury market. If too many stablecoin holders suddenly demand dollars, it could force a liquidation of Treasurys on reserve. Circle currently has over $32 billion worth of Treasurys in its reserves. Although this may not be significant enough to destabilize the multi-trillion dollar Treasury market, it can cause positive feedback and can increase fear in the market.
This series of events was predictable and expected. The root cause is the central bank's monetary policy. The Fed is destroying the money supply at the fastest rate on record. Since the Fed is still tightening, which has a long and variable lag effect, the liquidity crises we're seeing now are likely the tip of the iceberg.
The fact the Fed is still tightening so deep into the start of a financial crisis is unprecedented. When Lehman collapsed in September 2008, for example, the Fed had already pivoted over a year earlier (in August 2007).
Now, it seems that a financial crisis is already underway but the Fed remains unable to pivot due to record-high inflation. Eurodollar futures are still demanding that the Fed hike rates. The Fed is therefore trapped. It must choose between runaway inflation or widespread liquidity crises.
The yield curve is deeply inverted. This is a reliable indication that a recession is coming. The fact that it has been inverted for a while, and is deeply inverted, may be foreshadowing the extent and duration of the coming recession.
In my post below, I explained why I believe that the most likely outcome is severe stagflation. The Fed is in a Catch-22, and there's no way to avert some kind of a crisis. Indeed, the coming years will likely reveal to us what the consequences are for decades of limitless monetary easing.
Important Disclaimer
Nothing in this post should be considered financial advice. Trading and investing always involve risks and one should carefully review all such risks before making a trade or investment decision. Do not buy or sell any security based on anything in this post. Please consult with a financial advisor before making any financial decisions. This post is for educational purposes only.
Search in ideas for "RATIO CHART"

Long Manulife/Short SLFI worked for both companies and I preferred Manulife. It is larger than SLF for a reason: it's just better.
The other main reason I would want short SLF is that it DENIED me service which is basically fraud (lawsuits coming, right Arvid Shamiri who can be reached at (416) 213-7450).
The other reason is because the ratio chart of MFC/SLF shows a clear uptrend which means Manulife is outperforming Sunlife. The best part is you're "market hedged" and don't have to worry about grampa Powel fucking aorund with rates...

Semiconductors are off to a HOT Start in 2023Semiconductors are off to a HOT Start in 2023…after a COLD 2022…
As we begin 2023 looking at technology-oriented investments, a ‘consumer-slowdown’ and related macroeconomic factors are front and centre in investor considerations:
Worldwide shipments in personal computers (PCs) totalled 286.2 million units in 2022, a 16% decline from 20211.
Global Information Technology spending contracted 0.2% in 2022, dropping to a total figure of $4.38 trillion. It is rare to see this figure, which represents spending in many different categories of things, contract. PCs, smartphones and other devices are seeing the biggest cuts. Devices spending dropped more than 10% in 20222.
Taiwan Semiconductor Manufacturing Co. (TSMC) has indicated that its revenue can drop as much as roughly 5% in the current quarter, and that it expects lower capital expenditures when measured against the 2022 figures. TSMC is the world’s largest contract chip maker, and it has set the capital expenditure budget at $32 to $36 billion, which compares to $3.3 billion 20223.
However, the fact that semiconductors companies behave in a cyclical fashion, sensitive to the ups and downs of supply and demand is not new. There was a deluge of negative news and a downplaying of forward looking expectations in the second half of 2022. During earnings call, the CEOs of semiconductor companies put on a masterclass of seeking to lower forward-looking expectations.
Therefore, we could be in a position where, at the start of 2023, any news that does not represent the most bearish of possible outcomes is actually viewed positively.
Semiconductor Companies have Rallied Strongly to Start 2023
When many investors think about ‘growth’ or ‘tech’, they first thing of the Nasdaq 100 Index. This index functions as a baseline, where the top holdings are some of the world’s largest companies driving what we think of as ‘information technology’ forward.
In Figure 1a, we created a ratio chart, where, as the line moves from the left to the right of the page4:
An upward or positive slope represents the outperformance of Semiconductors companies relative to the Nasdaq 100 Index.
A downward or negative slope represents the underperformance of Semiconductors companies relative to the Nasdaq 100 Index.
When we see that the overall trend going back to 2015, we know that Semiconductors companies have generally performed strongly—since the line is higher at the right of the chart than the left, we know that Semiconductors outperformed the Nasdaq 100 Index. However, the line is not stable or smooth, and it is characterized by sweeping upward and downward trends. We show those figures specifically in Figure 1b.
This full period was strong from ‘tech stocks.’ The Nasdaq 100 Index was up 14.5% annualised, whereas Semiconductors were up 18.2% annualised.
Our ‘recent memory’ is colouring our perception, so what we likely remember closely is how it felt to watch Semiconductors drop -34.6%, but at the same time the Nasdaq 100 Index dropped -32.6%. 2022, as we all well know, was a rough year for the returns of technology-oriented stocks.
We would say that the 2022 experience was largely a result of what had come directly before—a massive expansion in near-term demand as many people shifted their working practices and purchased different types of hardware to allow them to work from anyway. From 17 June 2019 to 31 December 2021, Semiconductors returned 55.0%, annualised, while the broader Nasdaq 100 Index returned 36.4%.
We find it interesting that, even with all the same headwinds, like higher interest rates and a higher cost of capital and a lowered expectation of global economic growth, Semiconductor stocks have risen 15.7% in the first 3 weeks of 2023, which compares with the Nasdaq 100 Index rising 8.5%. 3 weeks is not a significant length of time, but it’s notable that this period immediately precedes companies reporting their earnings results from the period ended 31 December 2022. Maybe there is an implicit assumption in these returns that the results could be ‘less bad’ than what the CEOs of the Semiconductor companies had guided toward in prior quarters.
Conclusion: The Two Forces of 2023 that Determine the Semiconductor Return Experience
No one knows how the performance of semiconductor companies will evolve over 2023, but we are watching two critical areas of the space.
Even if 2022 was poor from a direct share price performance perspective, there was an enormous array of announcements of planned new plants to be built in different states in the U.S. There was also the passage of the ‘Chips Act.’ Even if it will take years before these plants will be making physical chips that can be sold, the signal that these companies are adjusting their supply chains to be less geographically reliant on Taiwan is an important one.
As we stated, the general CEO of a semiconductor company was focused on lowering guidance for the upcoming quarterly earnings results. When this happens, the future reports become less about the number on the page and more about whether the number on the page is ‘less bad’ than the guidance. If there is a perception that things are ‘less bad’ it’s possible that share prices can rally even if the results in isolation do not look great.
If Semiconductors can continue to outperform the Nasdaq 100 Index through the upcoming earnings season, this would lend strength to the concept that they may be able to hold onto this for the year, as opposed to us remembering that quick 3 week period of strong performance before the market gave it all back.
Sources
1 Source: Jacob, Denny. “PC Shipments Drop Sharply in a Slump Expected to Last Until 2024.” Wall Street Journal. 11 January 2023.
2 Source: Loten, Angus. “Global IT Spending Decreased in 2022.” Wall Street Journal. 18 January 2023.
3 Source: Jie, Yang. “TSMC Warns of Possible Revenue Drop, Spending Cut.” Wall Street Journal. 12 January 2023.
4 When referencing Figures 1a and 1b, ‘Semiconductors’ is defined as the universe of companies within the MSCI ACWI Semiconductor and Semiconductor Equipment Index.

XAG finally breaking out of the channel?Silver is about to break out of the channel.
Jordan Roy-Byrne, Founder and Editor of The Daily Gold, outlines that the key determinant factor for a real bull market in the gold, silver and the precious metals mining stocks will be when gold decidedly breaks above the S&P 500 on the ratio chart. There are plenty of historical periods one can point to as evidence that the gold and silver mining stocks outperformed and diverged from the US general equities in prior bear market periods.

A market version of the Tet offensive - SPX futuresHappy New Year to my followers! I hope 2023 will be a successful year of trading for all of you.
I'm presenting a map of what I'm seeing in the market here on the last trading day of the year. I believe we are far more bearish than bullish at this point in time. Surprisingly, we are still quite low on the VIX and put/call ratio charts as of today.
Unless the bulls can get over 3900 today on ES, the bear pennant I'm seeing will stand into next week. If we break below it today, I would think an unexpected sell off for at least the first week of the new year will be upon us. If that leg is a 5th wave, then we should have a healthy bounce afterwards, possibly creating a larger head and shoulders pattern into later January (red path).
If we get a complete meltdown starting next week, then we may have a WXY on our hands and this would be extremely surprising to most market participants (yellow path).
I lean toward the first scenario, but I'm open to the 2nd.
Either way, we are likely going to close the week firmly below the weekly 18 MA (bearish bias) and we are embedded bearish on the daily slow stochastic. We also had the daily 18 ma cross over the 50 and 100ma, a bearish cross. There isn't a lot to be bullish about in my opinion, but with the holidays it does seem like many are just "waiting to see what the new year brings".
If there aren't a lot of shorts in the market next week, the possibility of a faster move down is strengthened, as shorts have to buy the market to close their positions. If there are few buyers, the market could be extremely violent to the downside. With new year inflows from hedge funds, etc. I do expect buyers to step in, which is why I lean towards the first scenario.
good luck to all and see you in 2023!

The New Phase for TLT / BondsPurely technical analysis of TLT, ZB and TYX. My feeling for months is that Bonds will outperform the general markets. It's possible that we've peaked in TYX and TLT could rally towards 120 and higher. TLT/SPY ratio charts also explored
Good Luck!

HSI/SPY - time to be aware of ChinaKeep in mind this is a monthly chart, so we're looking at years and decades here.
This ratio chart of the HANG SENG INDEX divided by SPY is warning of a coming rush by investors into the Chinese markets. The China C wave I posted about may be done (see post attached below). If this falling wedge breaks out we could see a monumental shift towards the Chinese markets in the coming years, possibly spurred by their willingness to relax Covid controls and/or get better vaccines. This is a market mostly ignored by retail investors and that may change soon.
The monthly RSI has sharp bullish divergence. The monthly 18ma is sitting at 51.3 as I type today, getting over and holding that on a monthly close would be very bullish for HSI.
Good luck!

Using the SPX put call Ratio to trade SPX This chart provides insight into how to use the SPX P/C ratio chart coupled with Bollinger bands to make high-probability trading decisions. Each time the P/C spikes above or below the Bollinger band it mean reverts that same day. For this example, I used the SPX daily chart to show when price action hit resistance the P/C chart rose to extremes quickly the next day resulting in a sell-off in the SPX. I hope this adds another weapon to your trading tool belt!

Using the SPX put call Ratio to trade SPX This chart provides insight into how to use the SPX P/C ratio chart coupled with Bollinger bands to make high-probability trading decisions. Each time the P/C spikes above or below the Bollinger band it mean reverts that same day. For this example, I used the SPX daily chart to show when price action hit resistance the P/C chart rose to extremes quickly the next day resulting in a sell-off in the SPX. I hope this adds another weapon to your trading tool belt!

Weekly Ratio ChartsHere are the 4 main ration charts I look at weekly to give me a gauge of risk on vs risk off. Need to see see the riskier assets outperform before a new uptrend is confirmed. So far we can see a bounce in all the pairs, but the only one breaking out of a base so far is the small caps vs SPX. Discretionary, tech and growth are just bouncing back to overhead resistance at this point.

DIA: Week of Nov 14Hey everyone,
As I said and requested, here is my analysis on the DOW.
The DOW (DIA) and the Russel (IWM) are actually the most bullish looking stocks, at least as far as math and probs are concerned. Lots of bullishness is just being thrown in our faces here.
Let me break down the probabilities by index so you can just see this visually. The chart below shows the probability of the 3 indices (SPY, DIA and IWM) hitting either their first bull target or their first bear target:
So let's recap:
First off, we have a very clear breakout and hold from the qualitative regression downtrend. This is a traditionally bullish happening.
As with SPY, we have hit the second real time monthly bear target and on Friday we hit the first, real time (RTT) monthly high target at 337.79.
The next RTT is 341 followed by the third at 345.
While I was super focused on the numbers and the regression trend, I missed something that may have been obvious had I been paying closer attention:
This seems to, at this for right now, be following through.
Analysis:
So what can we expect next week?
DIA is yet to be put into Python for auto calculation of probs, so I had to do it manually and I forgot how much of a nerd I am. I love writing out math stuff haha. Anyway, our prospective targets are:
Bull:
1. 339.08 (50% prob)
2. 341.66 (6.1% prob)
3. 344.24 (<0.50% prob)
Bear
1.335.29 (38% prob)
2. 331.92 (0.3% prob)
3. 328.55 (<0.3% prob)
Technicals:
Unlike with SPY, Buyers have remain consistent. DIA is a little bit lower volume that SPY and can really signal a bit better what the buyer/seller sentiment is. So let's take a look at the buyer to seller ratio chart. And let's look at it YTD over the weekly.
And just for fun lets compare buyers to sellers on SPY vs DIA YTD:
Not sure if this is helpful, but I find it interesting haha.
For Monday, the technicals are erring on the bullish side. The targets are as follows:
Bull:
1. 337.51
2. 338.89
3. 340.27
Bear:
1. 336.29
2. 334.68
3. 333.07
So I think that concludes everything.
As always, leave your questions and comments and criticisms below!
Have a great weekend everyone!

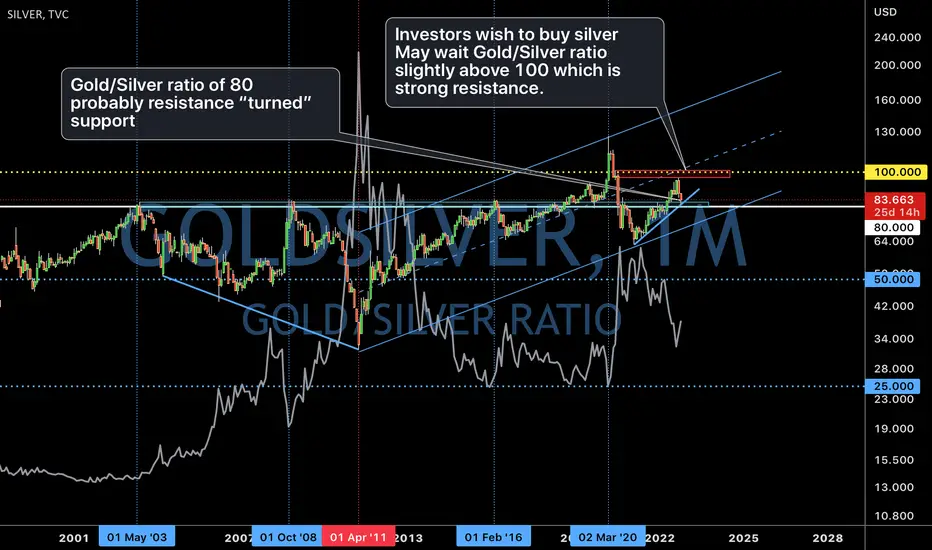
How to “invest” silver with gold/Silver ratio. 6/Oct/22Gold/Silver chart ratio normally used by hedge fund to “Swift” within “Silver” or “ Gold” assets. They usually “treat” ratio of >=100 as buy silver instead of gold vice versa for below <= 50..Instead of follow 50-100 rules. Traders could “read” gold/ratio chart spotting where its “support/resistance” located and decide to “hold” silver or gold.
An AAPL hedgeYes, nice move up today, but there are signs from AAPL that we may have another surprise leg down on the indexes. The Ratio charts for AAPL are all showing potential topping candles. I'm personally hedging with shorts on AAPL at the end of the day in case this is another bull trap and we go lower starting tomorrow. Also on the SPX, we're embedded bearish on the Slow Stochastic even with the move up today, so there's a chance that the larger players will sell this bounce.
Psychologically, you can imagine people who shorted "the news" this morning are now likely stopped out and people who are now bullish because AAPL is "ignoring the news" will be fooled into buying near the highs of today. Either way, 150 area is a strong resistance zone, so my thinking is to add a few shorts there just in case.
Good luck!

revisiting the BOND/SPY ratioIt's possible today was the day bonds finally reverse and start becoming attractive to investors again. This is a monthly chart with steep bullish divergence, so we're talking about a multi year (and possibly decades) of an uptrend from here. If you don't know how to read a ratio chart, it simply shows the amount of SPY etf it takes to make one BND etf. If it's in an uptrend, then it takes more SPY to make one BND. That could mean 3 possibilities -
1. SPY and BND rally together but BND outperforms to the upside
2. SPY keep going down and BND goes down much less in percentage
3. SPY keeps dropping or stays stagnant for years while BND rallies
My guess is 3. Especially if SPY drops and then meanders for years with meager returns, BONDS may become the play for the coming decade.

"capital flows analysis"#Uranium, #Silver and #Oil bull eras will be ENACTED once capital flows shifts are CONFIRMED via #gold versus #spx ratio chart.
Don't fight these tidal waves.
#fintwit

SIlverf#ckSilver tested it's main support and breakup candle this week with weekly bullish divergence. RSI near the weekly lows again. So far this level looks like it will hold it - bullish.
My Gold/Silver ratio chart reached the target (see analysis below). I think Silver can be a big surprise here, and gold/silver ratio will now start making it's way down to 60 or mid 50's.
Price target is 35 if this is correct. Good luck!
Title comes from the Smashing Pumpkins.

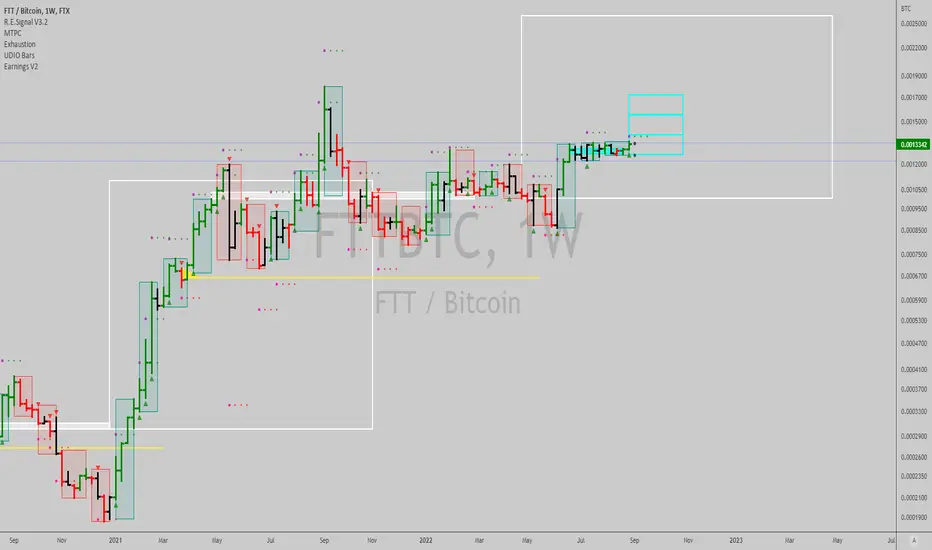
$FTTBTC: Pair trade setup...I think we can go long $FTTUSD against a same size short in $BTCUSD, the ratio chart shows there's 95% upside with 5% risk give or take, historically, in bear markets, exchange tokens have done well vs Bitcoin (like $BNBBTC did in the prior bear market back in 2018-2020). It might be worth a punt here...Betting on Sam might be a decent gamble, relatively vs Bitcoin at least. You can stake your $FTT as well, while you hold the $BTCUSD short, but need enough collateral to not be at risk. The bearish case in $BTCUSD might still be valid, judging by the action today, which erased yesterday's up bar. It's worth a shot.
Best of luck,
Ivan Labrie.
Uranium vs US oil Quarterly Ratio ChartUranium is still VERY cheap versus oil.
If oil sticks around 100$ in the following years, expect uranium to be over 165$.
Got U?
#uranium #oil #inflation #northstarbadcharts

$LINK We have a breakthroughWeekly log broke the blue arc. We also have a 2 year breakout of the declining RSA. Positive momentum. The LINKBTC ratio chart is also breaking out.

Weat etf vs SPY etfAccording to the ratio chart we should be close to a reversal here. If we do start rallying again it will take more spy to equal a share of the weat etf. After a long term base like this, the breakout rarely fails although a retest of the breakout is common.
As I said before, I think the inflation trade on AG commodities is about to start up again - regardless of what CPI says on Wednesday.

gold & silver bull era ends, not now#Gold vs #silver ratio chart still needs to get resolved downwards for silver & miners to thrive.

Munchy Crunchy AAPLI think it's another objective short, ratio charts look promising for a large move down either before or after earnings on the 28th. Good luck!

US30 year yields vs US10 year yieldsSomething EPIC is brewing!
US 30 year yields bottoming vs US 10 year yields.
This tracks #gold vs US equities ratio chart quite well.
And as I've shown you before, #silver/#platinum and miners track very that very closely.
Expect turbulence, but still keep focus on the prize.
